About Us
- Who We Are
- Why Fusion?
- What Others Say
- Our Blog
- Regulations and Legal Documents
- ID Documentation
Fusion Markets
Legal
Trading
- Products and Accounts Overview
- Zero Account
- Classic Account
- Demo Account
- Fusion Pro
- Swap Free Accounts
- Forex
- Metals
- Indices
- Energy & Soft Commodities
- Cryptocurrency
- US Share CFDs
- Trading Conditions
- Trading Calculators
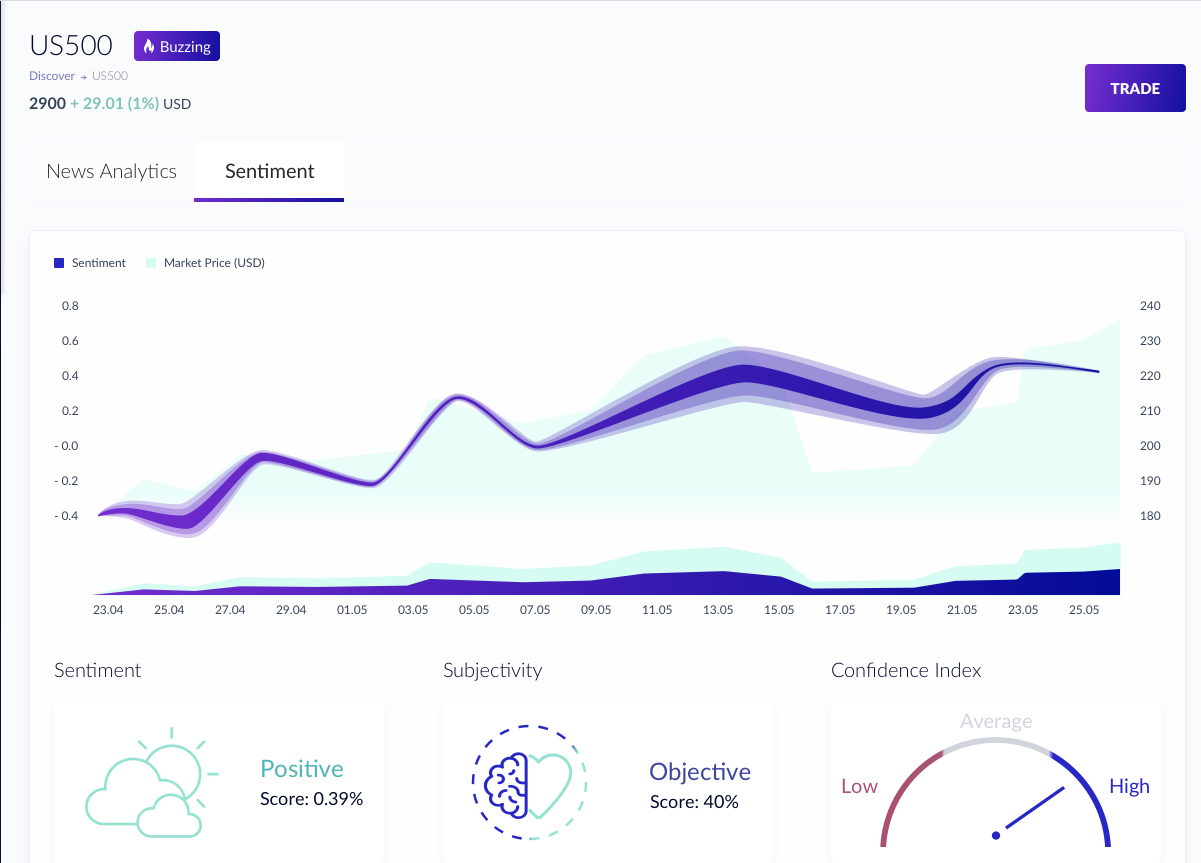
- Economic Calendar
- Live and Historical Spreads
- Trading Tools
- Fusion+ Copy Trading
- Sponsored VPS
Products and Accounts
Markets
Resources
Platform & Tools
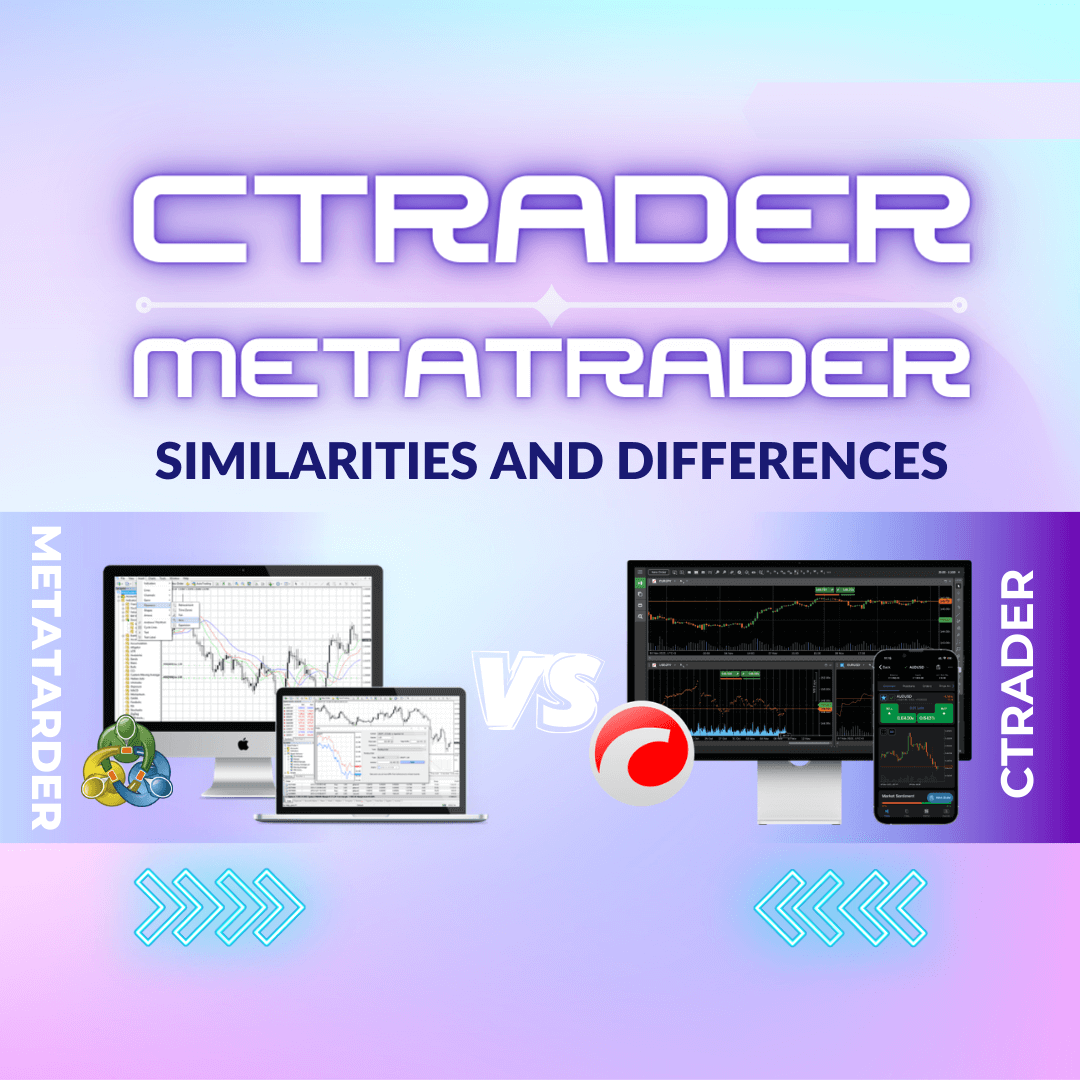
- MetaTrader 4
- MT4 Mobile Apps
- WebTrader for MT4
- MetaTrader 5
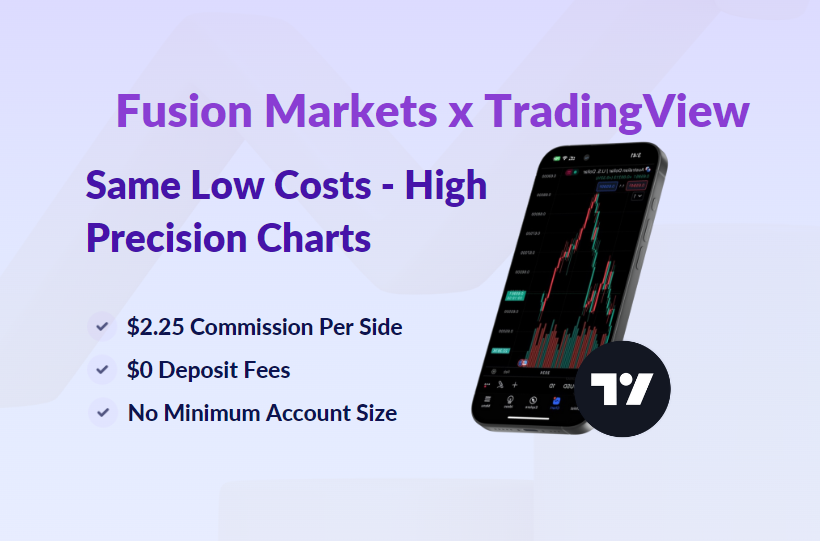
- TradingView Desktop
- cTrader Desktop
- cTrader Mobile
- cTrader Web
- Multi Account Manager
- DupliTrade
MetaTrader 4/5
TradingView
cTrader
More Platforms
Partner with us
Help
- Contact Us
- FAQ
Help